Determinants of Scoring in the 3M Open
This analysis is based on scores and stats from individual rounds in the five 3M Opens at TPC Twin Cities: 2,274 rounds in total.
Section 1: Absolute Correlation Coefficients with Score

The above graph demonstrates how the absolute value of the correlation coefficient between the score and the Strokes Gained (SG) metrics (SGTee, SGApp, SGATG, and SGP) varies by year.
SGTee: The correlation between the score and SGTee shows a slight downward trend over the years, starting from approximately 0.47 in 2019 and declining to about 0.36 in 2023. This suggests that the influence of tee shots on the overall score has decreased slightly over the years. This implies that while strong driving can still contribute positively to the score, its relative importance compared to other metrics has lessened.
SGApp: The correlation coefficient for SGApp has consistently remained the highest among the SG metrics, fluctuating between 0.56 and 0.69. This indicates that approach shots have a significant and stable impact on the overall score at TPC Twin Cities. Considerable weight should be given to players' approach shot statistics when assessing performance potential.
SGATG: The correlation for SGATG has varied, with a general decline from 0.33 in 2019 to around 0.22 in 2022, followed by a rise to 0.38 in 2023. This suggests that the impact of shots around the green has fluctuated but shows an increasing trend in recent years. Players' proficiency in this area should be monitored, as it appears to be regaining importance.
SGP: The correlation for SGP shows an overall increasing trend from 0.52 in 2019 to 0.62 in 2023, highlighting the growing importance of putting in determining the overall score. Significant emphasis should be placed on players' putting performance, as it has become a crucial factor in recent years.
From a handicapping perspective, the consistent patterns and trends indicate that approach shots and putting are the most critical factors influencing a player's score at TPC Twin Cities, with the relative importance of tee shots decreasing and shots around the green showing variable impact.

The above graph shows the variation in the absolute correlation between the score and traditional golf metrics (DrivingDistance, DrivingAccuracy, GreensInRegulation, Scrambling, and PPGIR) by year.
DrivingDistance: The correlation between the score and Driving Distance remains relatively low throughout the years, ranging from approximately 0.07 to 0.19. This suggests that driving distance has a minimal impact on the overall score. Driving distance should not be over-emphasised when predicting performance.
DrivingAccuracy: The correlation for Driving Accuracy is slightly higher, with values between 0.27 and 0.32, indicating a moderate influence on the score. Accurate drivers might have a slight edge, but this is not a primary determinant.
GreensInRegulation: This metric shows a strong and consistent correlation with the score, with values ranging from 0.54 to 0.63. This suggests that hitting greens in regulation is a crucial factor in determining the overall score. Players with strong Greens In Regulation statistics should be prioritixed.
Scrambling: The correlation for Scrambling fluctuates, with values between 0.40 and 0.56, indicating that the ability to save par when missing the green is moderately to strongly correlated with the overall score. Players' scrambling abilities should be considered as an important metric.
PPGIR: The Putting Performance on Greens in Regulation (PPGIR) shows a strong and stable correlation, with values ranging from 0.45 to 0.57, highlighting its importance in the overall score. PPGIR should be included as a key factor.
These findings indicate that traditional metrics, particularly Greens In Regulation and PPGIR, play a significant role in influencing the overall score at TPC Twin Cities. Handicappers should give priority to these metrics when evaluating player performance.

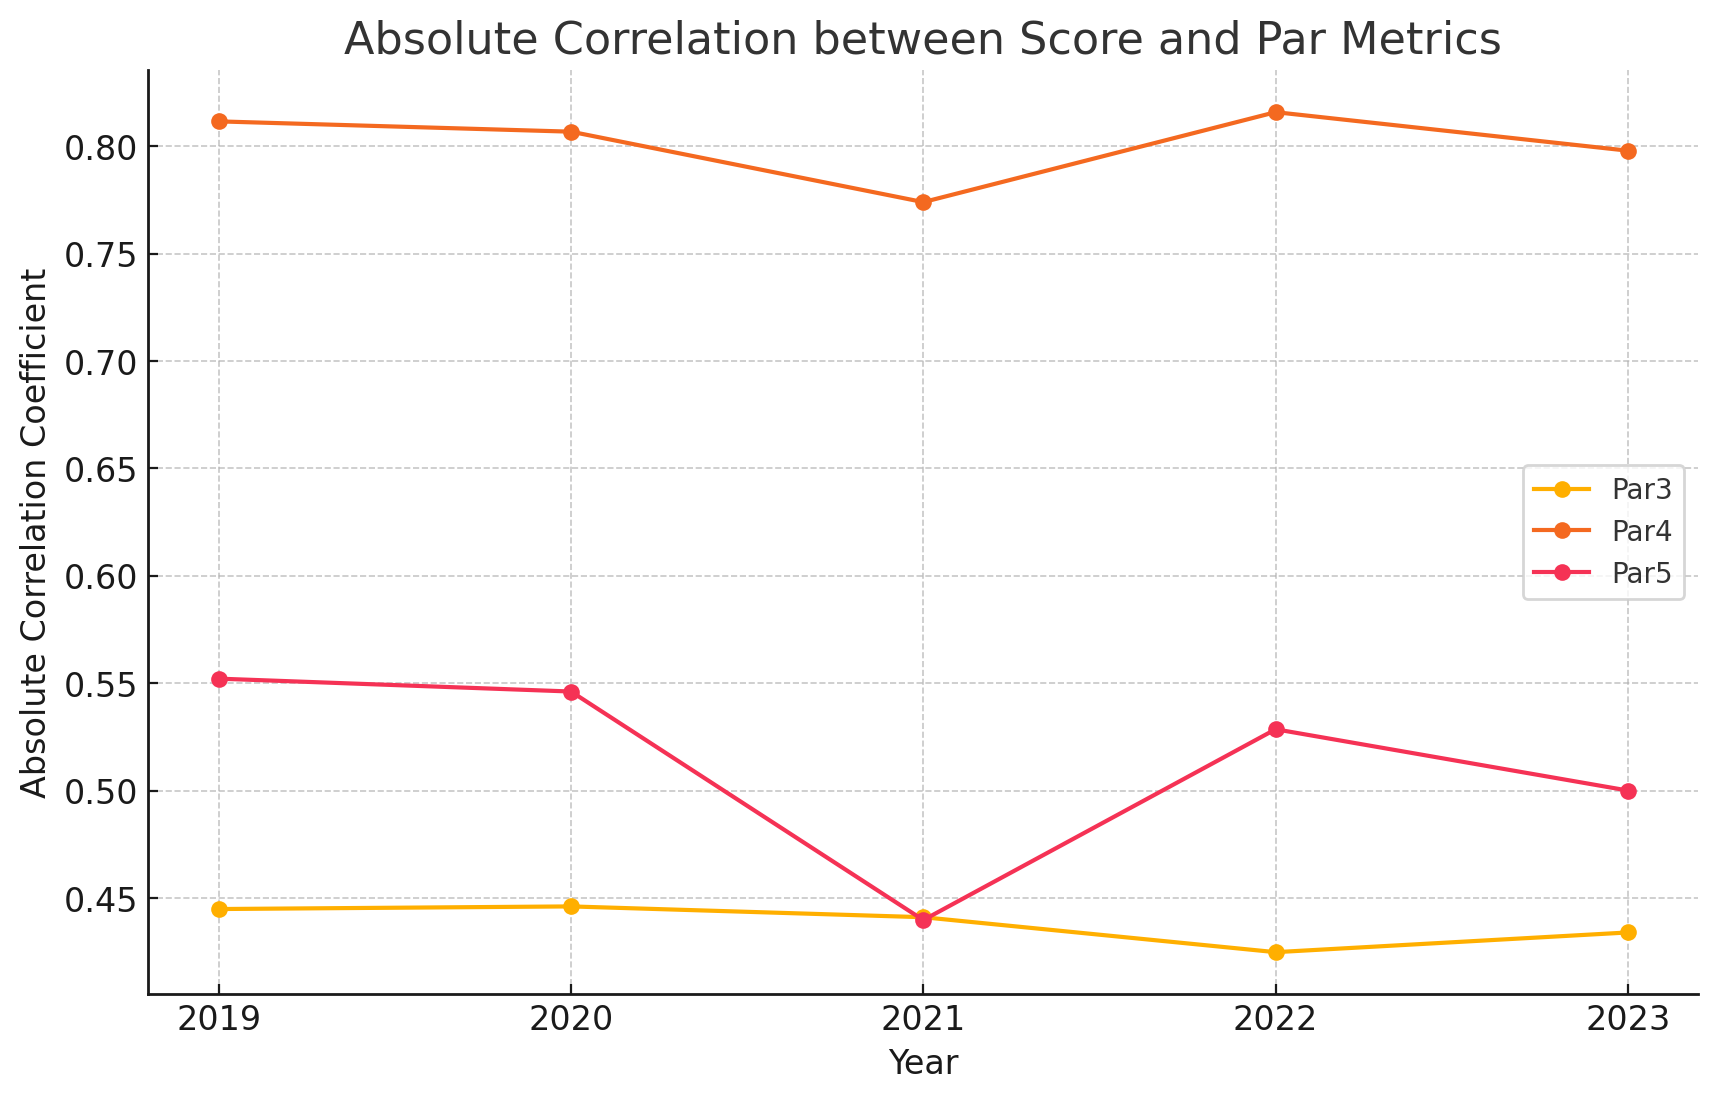
The above graph illustrates how the absolute value of the correlation coefficient between the score and par metrics (Par3, Par4, and Par5) varies by year.
Par3: The correlation between the score and Par 3 performance remains relatively stable, with values around 0.44 to 0.45, indicating a consistent moderate impact on the overall score. Par 3 performance should be considered but recognised as moderately impactful.
Par4: This metric shows the highest correlation with the score, ranging from 0.77 to 0.82, emphasising that performance on Par 4 holes is a significant determinant of the overall score. Par 4 performance should be heavily weighted when predicting player outcomes.
Par5: The correlation for Par 5 performance fluctuates between 0.44 and 0.55, suggesting a moderate to strong influence on the overall score, though not as pronounced as Par 4 performance. Par 5 performance shjould eb considered as important but secondary to Par 4.
From a handicapping perspective, these results underscore the critical importance of Par 4 performance in determining a player's score at TPC Twin Cities, with Par 3 and Par 5 performances also playing notable roles but to a lesser extent.
Section 2: Partial Dependence Plots against Score
Partial dependence plots (PDPs) are a tool used in machine learning and statistical modeling to illustrate the relationship between a target variable and one or more feature (e.g. SGApp, SGATG, DrivingDistance, GreensInRegulation). They show the marginal effect of a feature on the predicted outcome of a model. PDPs are particularly useful for understanding how individual features impact the target variable, allowing for better interpretation and insights from the model.
In determining the value of Score, PDPs can help visualize how changes in each feature impact the predicted score, holding other features constant. This can provide insights into which features are most influential and how they affect the score.

The partial dependence plots for SGTee, SGApp, SGATG, and SGP provide insights into how changes in these metrics influence the predicted score.
SGTee: The plot shows that an increase in SGTee (Strokes Gained Tee-to-Green) is associated with a decrease in the predicted score. This indicates that better performance in tee shots positively impacts the overall score. Players who consistently gain strokes off the tee should be favoured.
SGApp: The plot for SGApp (Strokes Gained Approach-the-Green) demonstrates a strong negative relationship with the score. As SGApp increases, the predicted score decreases significantly, highlighting the critical role of approach shots in scoring well. Players with strong approach play should be prioritised.
SGATG: The partial dependence plot for SGATG (Strokes Gained Around-the-Green) shows a moderate negative impact on the score with increases in SGATG. This indicates that good performance around the green can help lower scores, though its impact is less pronounced than approach shots.
SGP: The plot for SGP (Strokes Gained Putting) reveals a negative relationship with the score, indicating that better putting performance contributes to lower scores. Significant emphasis should be placed on players with strong putting skills.
These plots confirm that approach shots and putting are key factors in lowering scores at TPC Twin Cities, with tee shots and shots around the green also contributing positively.

The partial dependence plots for DrivingDistance, DrivingAccuracy, GreensInRegulation, Scrambling, and PPGIR illustrate how these traditional metrics affect the predicted score.
DrivingDistance: The plot indicates a weak negative relationship between Driving Distance and the score. While longer drives can slightly improve scores, the impact is minimal. Driving distance alone should not be overvalued.
DrivingAccuracy: The plot shows that better Driving Accuracy is associated with lower scores, but the effect is moderate. Accurate drivers are somewhat favoured, but this is not the most critical factor.
GreensInRegulation: The plot demonstrates a strong negative relationship between Greens in Regulation and the score. Hitting more greens in regulation significantly lowers the predicted score, making this a crucial metric.
Scrambling: The plot for Scrambling shows a moderate negative relationship with the score. Players who can save par after missing greens tend to have better scores. Scrambling ability should be considered.
PPGIR: The plot for PPGIR (Putting Performance on Greens in Regulation) shows a strong negative impact on the score. Better putting on greens in regulation significantly lowers the score, highlighting its importance.
Handicappers should prioritise Greens in Regulation and PPGIR when evaluating player performance at TPC Twin Cities, with moderate consideration for Driving Accuracy and Scrambling.

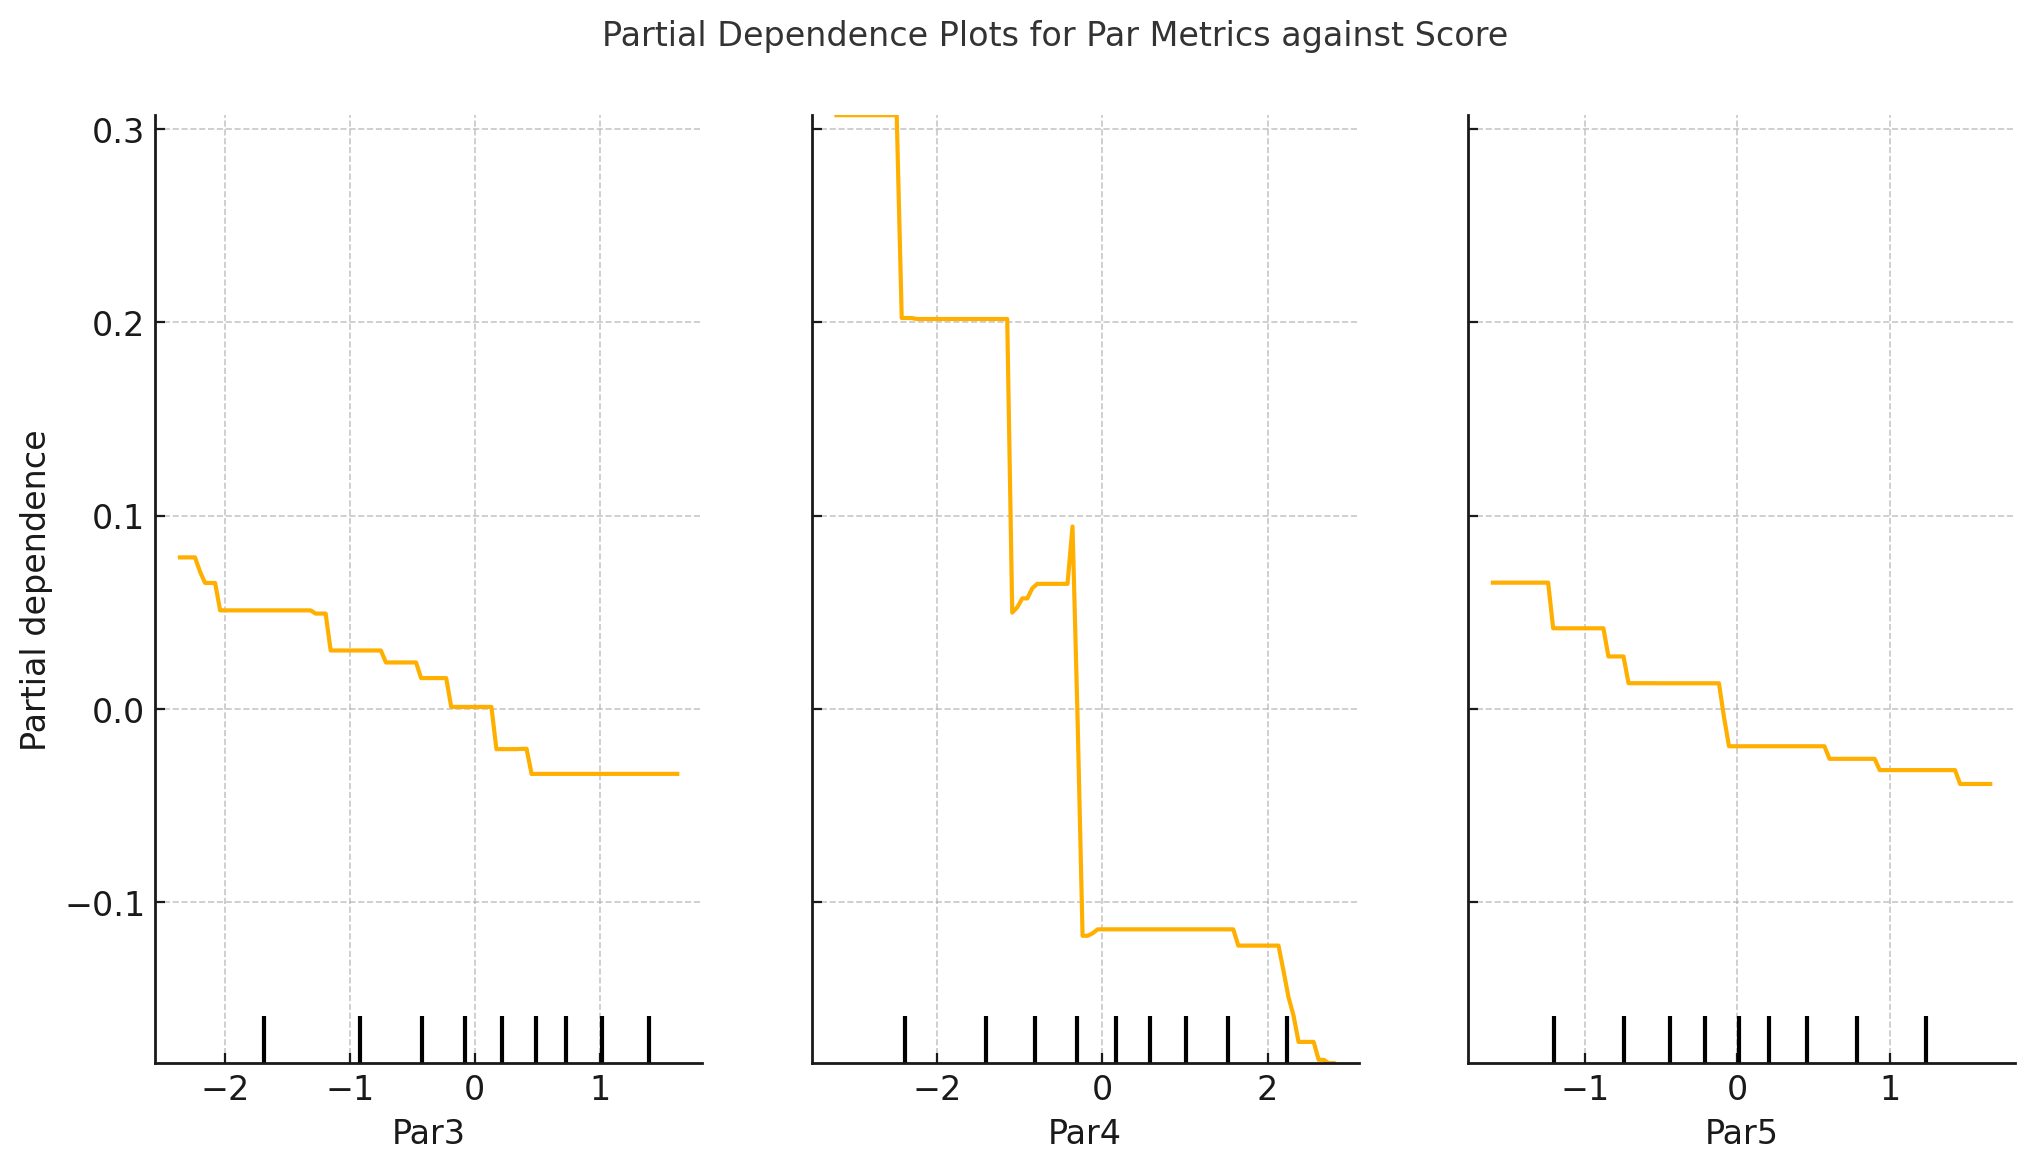
The partial dependence plots for Par3, Par4, and Par5 provide insights into how performance on different par holes affects the predicted score.
Par3: The plot shows a negative relationship between Par 3 performance and the score, indicating that better performance on Par 3 holes helps lower scores. However, the impact is moderate compared to Par 4 holes.
Par4: The plot for Par 4 performance shows a strong negative relationship with the score. Performance on Par 4 holes is a significant determinant of the overall score. Par 4 performance should be heavily weighted in any assessment.
Par5: The plot for Par 5 performance also shows a negative relationship with the score, but the impact is less pronounced than for Par 4 holes. Good performance on Par 5 holes contributes to lower scores but to a lesser extent.
From a handicapping perspective, Par 4 performance is the most critical factor at TPC Twin Cities, with Par 3 and Par 5 performances also playing important roles but to a lesser degree.
Section 3: Importance of Each Metric in Determining Score
Random Forest Regressor and Feature Importance
Random Forest Regressor is an ensemble learning method that constructs multiple decision trees during training and outputs the average prediction. It combines the predictions of several models to improve accuracy and robustness.
Feature importance is a technique used to interpret a machine learning model. It refers to the score that quantifies the contribution of each feature to the prediction made by the model.
In a Random Forest, the importance of a feature is computed by looking at how much the feature decreases the impurity (e.g., variance for regression tasks) across all the trees in the forest. The more a feature decreases the impurity, the more important it is considered.
The calculated importance scores for all features are then normalized to give relative importance as a percentage. This shows the relative contribution of each feature to the prediction task.
Interpreting Feature Importance
Features with high relative importance percentages have a strong impact on the model's predictions. They are crucial for accurate predictions and indicate key areas where performance matters most.
Features with low relative importance have a minimal impact on the model's predictions. While they can still contribute, they are less critical.

- SGTee (17.40%): Compared to the PGA Tour average (24.82%), strokes gained off the tee are less important at TPC Twin Cities. This suggests that driving distance and accuracy are less predictive of scoring here than on the average PGA Tour course.
- SGApp (41.13%): This is significantly higher than the PGA Tour average (26.77%), indicating that approach shots are far more critical at TPC Twin Cities. For score prediction, a player's ability to consistently hit precise approach shots is a key indicator of potential performance.
- SGATG (11.85%): Lower than the PGA Tour average (24.44%), shots around the green are less influential. This suggests that players can recover from misses around the green without significantly affecting their scores.
- SGP (29.62%): Higher than the PGA Tour average (23.98%), putting is more important for score prediction at TPC Twin Cities. Consistent putting performance is crucial for estimating a player's score.
Summary: At TPC Twin Cities, approach shots and putting are more critical for score prediction than on average PGA Tour courses. Driving off the tee and shots around the green are less influential in comparison.

- DrivingDistance (6.22%): This is lower than the PGA Tour average (9.31%), indicating that driving distance is less predictive of scores at TPC Twin Cities. Accuracy and short game play a larger role.
- DrivingAccuracy (4.20%): Slightly higher than the PGA Tour average (3.77%), but still relatively low in importance. This suggests that while accuracy helps, it is not the primary driver of scoring predictions.
- GreensInRegulation (40.08%): Much higher than the PGA Tour average (29.77%). Hitting greens in regulation is a key predictor of scores at TPC Twin Cities, emphasizing the importance of precise iron play.
- Scrambling (26.10%): Close to the PGA Tour average (27.02%), indicating that scrambling ability is consistently important for score prediction, reflecting a player's ability to recover and save par.
- PPGIR (23.40%): Lower than the PGA Tour average (30.13%), but still a significant predictor. This suggests that while putting in regulation is crucial, it shares importance with scrambling and greens in regulation.
Summary: At TPC Twin Cities, Greens in Regulation is more critical for score prediction than on average PGA Tour courses, while driving distance is less important. Scrambling and PPGIR remain significant but are more balanced in their predictive value.

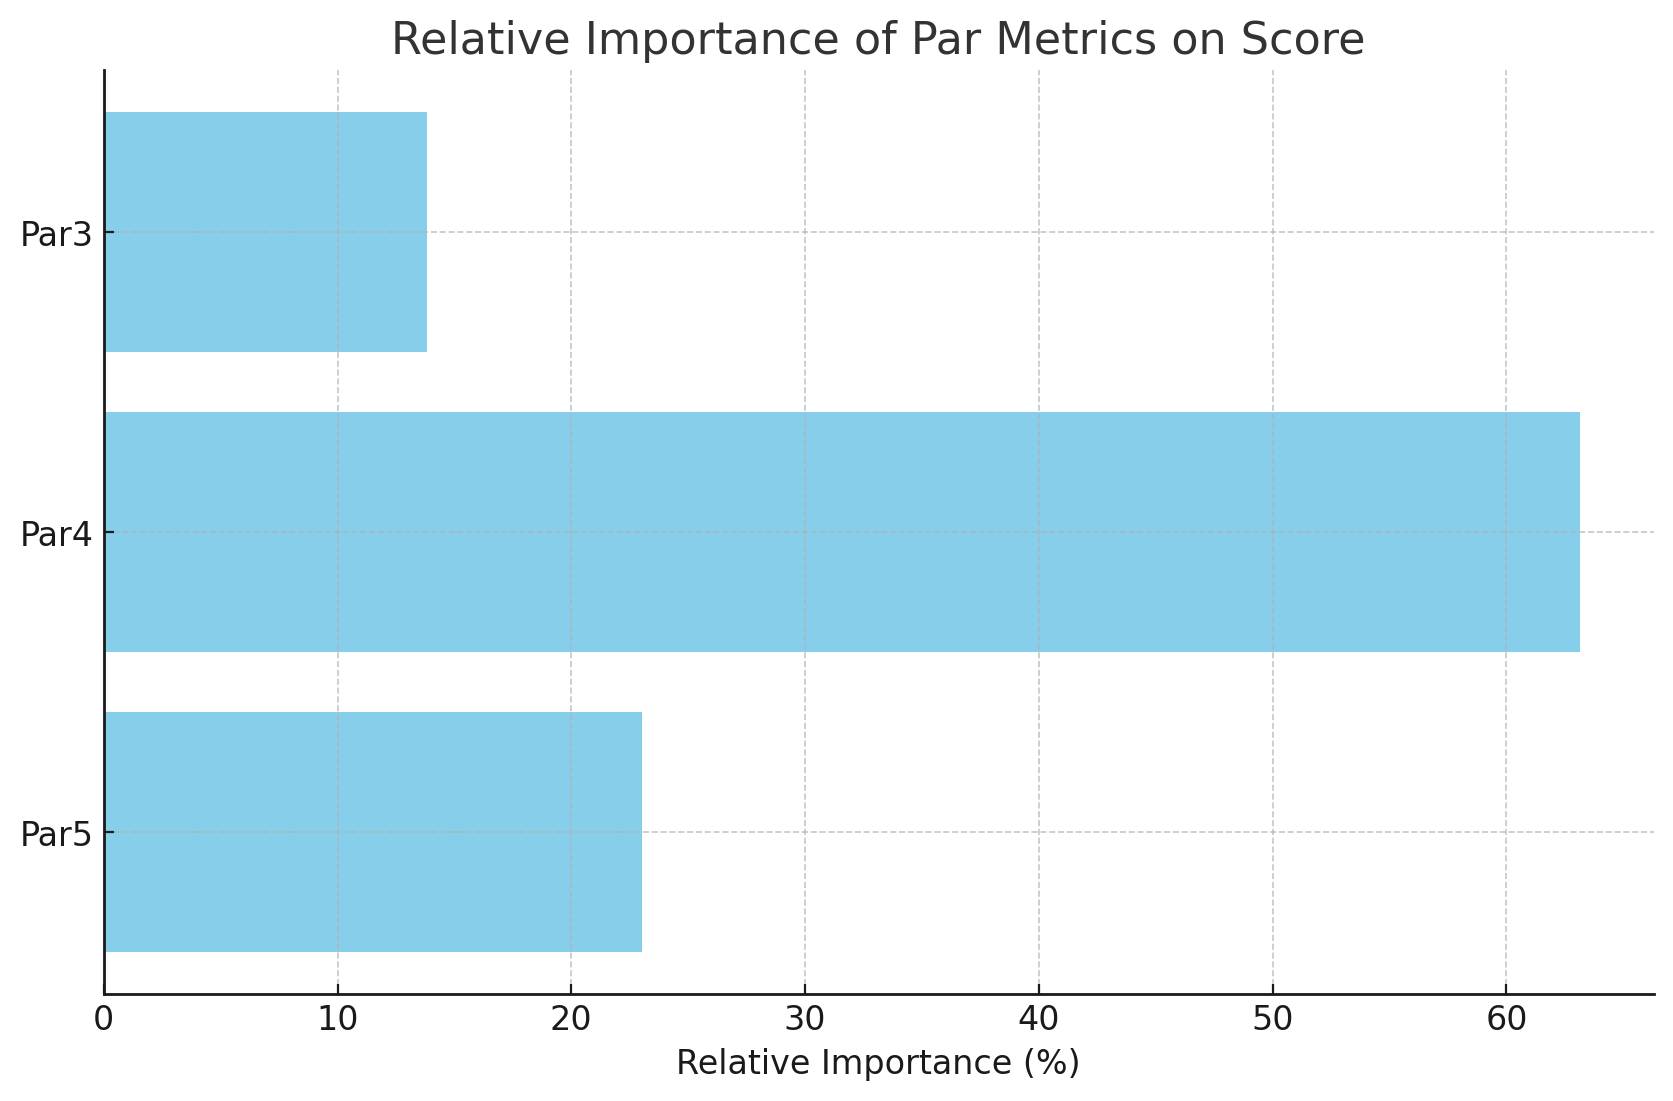
- Par3 (10.93%): Lower than the PGA Tour average (17.32%), suggesting that Par 3 holes have less influence on overall scores at TPC Twin Cities.
- Par4 (75.01%): Much higher than the PGA Tour average (67.12%), indicating that performance on Par 4 holes is particularly critical for score prediction at TPC Twin Cities. These holes significantly influence the overall score prediction.
- Par5 (14.06%): Slightly lower than the PGA Tour average (15.56%), but still relevant. Effective play on Par 5s can contribute to score prediction, though not as significantly as Par 4s.
Summary: Par 4 performance is exceptionally more important at TPC Twin Cities compared to the PGA Tour average. Par 3s are less influential, while Par 5s remain consistently relevant for score prediction.
Conclusion
In summary, the key differences from PGA Tour averages in terms of relative importance for score prediction at TPC Twin Cities are:
- Higher Importance: Approach shots (SGApp), putting (SGP), and Greens in Regulation are more crucial for predicting scores.
- Lower Importance: Driving distance (SGTee) and shots around the green (SGATG) have less predictive power.
- Par 4 Performance: Par 4 holes are significantly more critical for score predictions compared to Par 3 and Par 5 holes, emphasizing their influence on overall scoring at TPC Twin Cities.
Top 5 Ranked Players - 2024 3M Open
The table below shows the top-5 ranked players and their average estimated scores from the different Random Forest models above.
| Player | Score |
|---|---|
| Luke Clanton | 68.44 |
| Erik Van Rooyen | 68.95 |
| Henrik Norlander | 69.06 |
| Ben Griffin | 69.10 |
| Chan Kim | 69.10 |
Estimated scores for all players can be found here.